Optimal Financial Investment over the Life Cycle
![]()
Economists like to compare actual human behavior to the choices that would be made by a "rational" agent who understands all the complexities of a decision.
But determining the mathematically optimal amount to save for retirement, and how best to invest those savings, turns out to be much harder than calculating how to land the Apollo spacecraft on the moon. In fact, the computational tools that economists use to solve such problems descend directly from those originally developed to optimize Apollo trajectories -- with 50 years of further development.
By 2005, those tools were finally good enough to give financial advice that deserved to be taken seriously -- if by "taken seriously" we mean that economists's own personal decisions (and the advice they give to friends and family) were influenced by the results. (A study by Cocco, Gomes, and Maenhout -- CGM for short -- is the standard reference.)
But even today, these tools are not widely used, because it still takes years of study to master them.
In 2015, the U.S. Consumer Financial Protection Bureau funded the creation of the Econ-ARK open source software project, whose purpose is to make such tools much more accessible, both to researchers and to the wider public. Thanks to subsequent funding by the Sloan Foundation and the Think Forward Initiative, the Econ-ARK team is proud to announce the newest module in our toolkit: ConsPortfolioModel can calculate the optimal solution to a lifetime optimal saving problem where the consumer can choose how much to invest in risky (but expected high-return) versus safe (but low-return) assets.
Our hope is that such transparent and publicly available tools will eventually provide an alternative to the proprietary (and mysterious) advice that has recently become widely available from "robo advisors" (and the even more mysterious advice that has been available from human advisors much longer).
The Problem
Nobody saving for retirement knows what the future holds. They are likely to change jobs several times during their career, and each new job will have a different profile of income growth and risk; they might develop health problems that cut life short before retirement (so retirement savings would be wasted), or they might turn out to be so healthy that they live to 100 (with a danger of outliving their savings).
Nor does anybody know what the payoffs will be for alternative investment choices. "Risky" assets like stocks have historically earned higher returns than "safe" assets like government bonds -- but there is no guarantee that stocks will outperform bonds over any particular period (like, until you retire).
Uncertainties like these are why the household's problem is harder than NASA's. The motion of a spacecraft is predictable: Point it in a certain direction with a certain velocity, and Newton's equations tell you exactly where it will be far into the future. In contrast, over a lifetime that is vulnerable to many risks, a wise financial decision must take into account all of the possible outcomes.
"Big data" now allows us to quantify the most important risks. We can measure how often people change jobs (taking into account education, occupation and so on), and what happens to income after job changes. Job-related income uncertainty can thus be represented as a statistical distribution over the many possible future outcomes. The same is true for other kinds of risk (like health risk). When all the biggest risks have been quantified, we can calculate the joint probabilities of every conceivable draw, and weight each outcome by its probability and its desirability. ConsPortfolioModel calculates how the ultimate outcomes (like, retirement income) depend probabilistically on the current choice of saving and portfolio choice, then computes the choices that are "optimal" for consumers with different preferences (toward risk, for example).
The Solution
Replicating the Standard Model
Our first use of ConsPortfolioModel has been to replicate the results of the above-mentioned CGM study.
A key input is the degree of consumers' "risk aversion." Researchers have found that many kinds of consumer behavior are consistent with values of "relative risk aversion" in the range from 2 to 4.
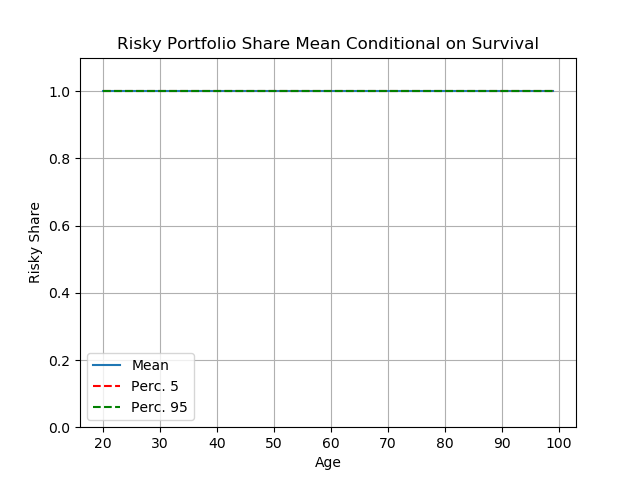
The most striking conclusion of the CGM paper is captured in figure 1. ConsPortfolioModel assumes that consumers with risk aversion of 3 can choose between a "risky" asset with expected performance (for risk and return) like the stock market, versus a "safe" asset with lower returns historically typical of safe assets (like government bonds). The figure shows, by age, the optimal risky share -- that is, the proportion of savings that it would be optimal to invest in the "risky" asset. The fact that the proportion is stuck at 1.0 at every age means that ConsPortfolioModel says the optimal choice is always to invest 100 percent of your savings in stocks!
Maybe Risk Aversion is Much Greater than 3?
Parameters like "relative risk aversion" are hard to measure. Maybe the conventional value of 3, which works well to explain other choices, is inappropriate here -- perhaps people just hate stock market risk more than other kinds of risk that would have similar financial consequences.
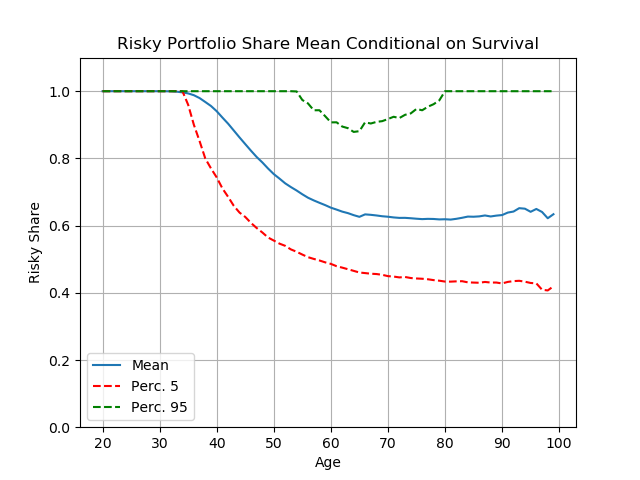
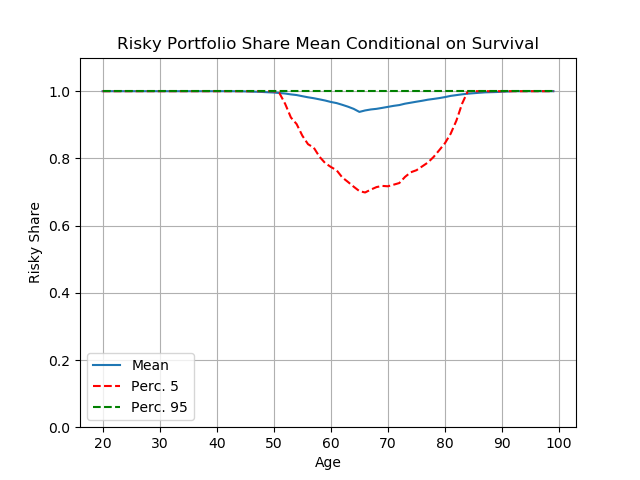
Figure 2 shows the profile of the mean risky share for a consumer with risk aversion of 6, twice the conventional value. (Think of your most risk-averse neighbor or relative).
Even with such high risk aversion, the model says that until about age 35 it is still optimal to invest all of your savings in the stock market. After that, the risky share declines gradually until it stabilizes at around 65 percent at age 65. (The dashing lines show the choices made by people at the 5th and 95th percentiles of the distribution of the risky share).
These results reflect two aspects of the model:
- Young people start with little or no assets
- Their income comes mostly from working in the labor market
- If you have only a small amount of wealth, the absolute dollar size of the risk you are taking by investing your (modest) retirement savings in the stock market is small, so (rationally) the higher expected returns more than make up for the (relatively small) risk
- In retirement, you plan to finance a lot of your future spending from your savings
- So, investing everything in the stock market would put a large proportion of your retirement spending at risk
- The "equity premium" is nevertheless large enough to make it worthwhile for most people to keep half or more of their assets in stocks
What Do People Actually Do?
The pattern above is strikingly different from the actual choices that people make.
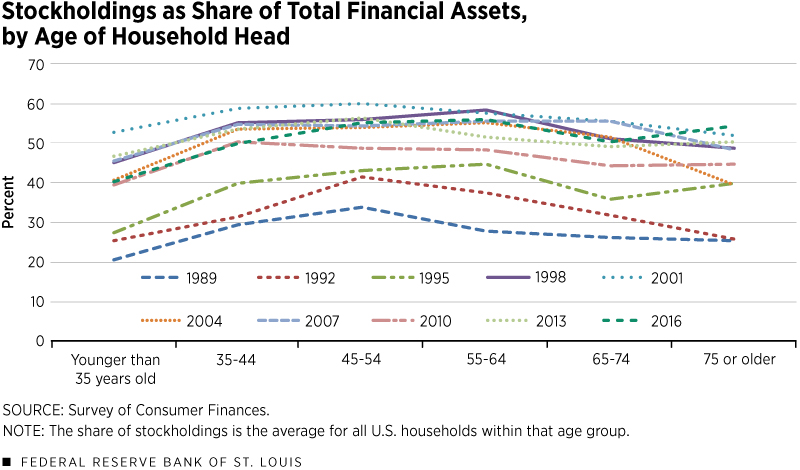
The figure below shows data, from the Federal Reserve's triennial Survey of Consumer Finances, for the proportion of their assets that people at different ages actually have invested in stocks and other risky assets (from this article).
The risky share that people choose in real life is much lower than the model says is optimal (even with extreme risk aversion of 6).
Below we examine two possible interpretations:
- The model is basically the right framework for thinking about these questions
- But some of its assumptions/calibrations are wrong
- People are behaving optimally, but the model is still missing some important features of reality
What Assumptions Might Be Wrong?
Maybe People Have Been Too Pessimistic About the Equity Premium
The calculations above assume that people expect an equity premium of 4 percent, which is a good estimate of what the average premium has been on stock market investments over the past century. (Risk is also assumed to match historical experience.)
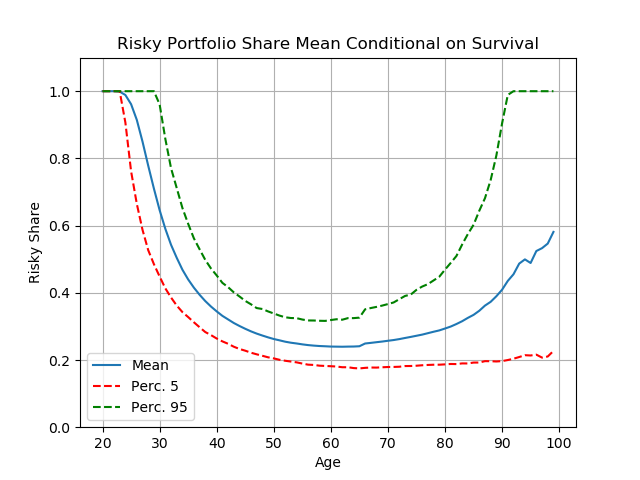
But nobody could have known beforehand that equity premia would turn out to be so high. Perhaps people chose lower risky shares because they mistakenly believed that risk premia would be lower. Figure 3 below shows the consequences if people with a high risk aversion parameter (6) believe the equity premium will be only two percent (around its historical average in the U.S. before 1941; some respected economists think such rates might prevail in the future).
The shape of the figure is much the same as before; in particular, the youngest people still hold 100 percent of their portfolios in risky assets. But the proportion of their portfolios that middle-aged and older people hold in stocks falls from about 50 to about 20 percent.
Is Pessimism Enough?
The preceding figure assumes that relative risk aversion is very high (6). A natural question is whether, when people are pessimistic about the equity premium, their optimal risky shares might be low even if they are not so risk averse.
Nope. Figure 4 below shows that, even with the pessimistic beliefs that the equity premium will be only 2 percent, if relative risk aversion has a conventional value of 3 then the optimal risky share is still 100 percent for both young and old people, and on average reaches a low point of about 90 percent for people nearing retirement.
Comparison to Professional Advice
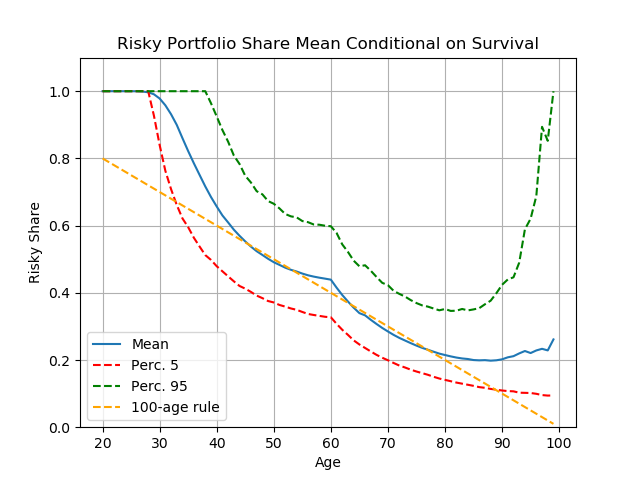
Investment advisors sometimes advocate the "100 minus age" rule: Your portfolio share in risky assets should be 100 minus your age; so, a 60 year old would have 100-60=40 percent in stocks.
For highly risk averse people (risk aversion of 6), Figure 5 below shows that the rule's recommendation (orange dashing line) is not too different from what comes out of the model (in blue). While the rule would say that the 25 year old should put 75 percent of their savings in the stock market and the model says 100 percent, they agree that the young person's proportion should be high, and also agree that the proportion should decline during working life.
But the rule and the model disagree about what should happen after retirement. The rule recommends steadily reducing your exposure to risky assets as you get older, while the model says that after retirement your exposure should remain at about the same level as late in your working life, or even increase.
Other Experiments
Financial advisors, who have daily contact with real human beings, may have an insight that the model does not incorporate. For example, perhaps the perceived riskiness of stock investments increases as you grow older.
The point of creating the ConsPortfolioModel tool was to make it easy for anyone to explore possibilities like these.
The README describes how you can use the tool to explore such model modifications; for example, if the perception of the riskiness of stock investments increases with age, the model can match the "100 minus age" rule's advice that retired people should reduce their exposure to stock market risk.
What Might Still Be Missing
Some experiments are NOT yet possible with our toolkit. Perhaps the most important is that we have no way to take into account the risks entailed in homeownership. Houses, like stocks, are assets whose price can go up or down. Since housing wealth constitutes the majority of the wealth of most consumers, the model's failure to consider the effects that homeownership should have on the optimal choice of risky financial investment is a failing serious enough to call into question the soundness of its conclusions.
The Think Forward Initiative grant that funded this work has a second component: Calculating the optimal risky share taking homeownership risks into acccount. This question is at the frontier of what is possible using the kinds of tools we are developing. We are interested to see whether a proper treatment of homeownership will be enough to temper the recommendations of the model to invest heavily in risky financial assets. The answer is not clear -- which is why we need a model!
Code
The computer code to reproduce all of the figures in this notebook, and a great many others, can be executed by installing the Econ-ARK toolkit and cloning the PortfolioChoiceBlogPost repository. The small unix program do_all_code.sh at the root level of the PortfolioChoiceBlogPost directory produces everything.
A replication of main results of the CGM paper is referenced in a link below.
The Econ-ARK toolkit is available at GitHub, and the ConsPortfolioModel is documented here.
References
Cocco, J. F., Gomes, F. J., & Maenhout, P. J. (2005). Consumption and portfolio choice over the life cycle. The Review of Financial Studies, 18(2), 491-533. doi.org/10.1093/rfs/hhi017
Velásquez-Giraldo, Mateo and Matthew Zahn. econ-ark/REMARK replication of Cocco, Gomes, and Maenhout (2005)](doi.org/10.1093/rfs/hhi017.